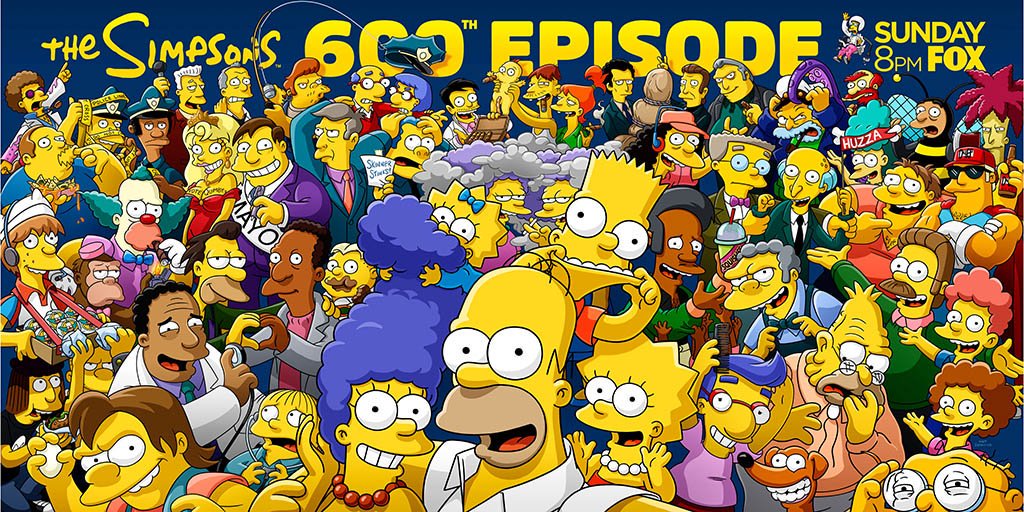
“The Simpsons”‘ 28th season was one of the few shows on broadcast TV this past season that saw its audience increase year-on-year (contrary to my calculations, but they’re probably wrong!), with its 18-49 figure improving ever so slightly. Both viewership overall and in the 18-49 demographic saw improvement from the boosts given to the show by football early in the season – and once that reliable lead-in had gone, the audience gains evaporated, and the show saw three new all-time lows in one season – and went fractional for the first time ever… twice.
Here’s a comparison to last season:
This season’s 18-49 rating average: 1.76
Last season’s 18-49 rating average: 1.74
This season’s overall viewership rating average: 4.147 million
Last season’s overall viewership rating average: 3.999 million
This season’s audience share average: 5.6%
Last season’s audience share average: 5.4%
EDIT: Now to add the ratings following catch-up. Live+3 ratings are defined by viewers watching on the night, and on catch-up over the next three days. Live+7 ratings are defined by viewers watching within seven days of broadcast.
18-49 average in Live+3 ratings: 2.0 (0.2 gain from Live+SD), #26 rank
Overall viewership average in Live+3 ratings: 4.637 million (490,000 gain), #90 rank
18-49 average in Live+7 ratings: 2.1 (0.1 gain from Live+3; 0.3 gain from Live+SD), #28 rank
Overall viewership average in Live+7 ratings: 4.838 million (201,000 gain from Live+3; 691,000 gain from Live+SD) , #90 rank
Here’s some other generic facts about this season’s ratings:
In live+same day ratings, “The Simpsons” was the 74th most-watched broadcast TV show last season in overall viewership, tied with “Dateline Saturday Mystery” on NBC, but ranked significantly higher in 18-49s, placing 15th (at 1.8), tied with CBS’ “Survivor”. This is an improvement on last season, which ranked 92nd and 35th respectively.
“The Simpsons” was also FOX’s second-highest-rated show this season, after the freefalling “Empire”.
One episode that aired in the fall was watched by under three million – the first time the show had an episode seen by fewer than three million in fall ever.
Three episodes in the season had fewer viewers than the lowest-rated episode last season (2.315m), with six below the 18-49 rating for the lowest-rated episode last season (1.04) – all said episodes being in the 2017 portion of the season.
Lowest 18-49 rating this season, and episode: 0.92, “The Caper Chase”
Lowest overall viewership rating this season, and ep: 2.128 million, “The Caper Chase”
Highest 18-49 rating this season, and episode: 3.50, “Pork and Burns”
Highest overall viewership rating last season, and ep: 8.187 million, “Pork and Burns”
Number of episodes with or above a 3.0 18-49 rating this season: Two – “Treehouse of Horror XVIII” (3.0) and “Pork and Burns” (3.2).
Number of episodes with or above a 3.0 18-49 rating last season: One – “Teenage Mutant Milk-Caused Hurdles” (3.6)
Number of episodes with a 2.0-2.9 18-49 rating this season: Four – “Friends and Family” (2.65), “The Last Traction Hero” (2.4), “The Nightmare After Krustmas” (2.3), “The Great Phatsby” (2.78)
Number of episodes with a 2.0-2.9 18-49 rating last season: Five
Number of episodes with a 1.0-1.9 18-49 rating this season: Eleven
Number of episodes with a 1.0-1.9 18-49 rating last season: Sixteen
Number of episodes below a 1.0 18-49 rating this season: Three – “The Caper Chase” (0.92), “Looking for Mr. Goodbart” (0.97), “Dogtown” (0.94)
Number of episodes below a 1.0 18-49 rating last season: None!
And now, just to be petty:
Number of times “Family Guy” beat “The Simpsons” this season: Seven times in 18-49s, twice in overall viewership.
That’s probably it for me until October 3rd! See you then!
Sources: TVBytheNumbers, SpottedRatings, TVSeriesFinale (all of whose calculations I’ve used, since I can’t rely on mine!)